

How to find the perfect stock to trade?
How to find the perfect stock to trade?

When I started to learn about trading I was impressed how top traders were able to assess a stock pattern in just a few seconds. For me, looking at candlesticks, was like looking at the Chinese letters (I do not understand or speak Chinese) and trying to read them out loud.
To learn the candlestick language you need to respect the same rules as learning a foreign language: first, you need to understand the letters (candlesticks). Then, to use them in words (interpret a group of candlesticks). And in the last stage, to be able to use punctuation signs and form sentences (learn to analyze more indicators such as moving averages and volumes).
It is very well known that almost all the stocks (3/4) move with the market. If the market is bullish, mostly all the stocks are increasing. And vice-versa, when the market is bearish, mostly all the stocks are trending lower. So, as a first rule, if you want to go long, please be sure that the market is on an uptrend.
The objective for finding the perfect stock is to learn how to identify the trades patterns with big potential but at the same, with low risk. I really do not look or chase for stocks that advance big during the day. The train has left. Instead, I try to find stocks that might advance big in the following day(s) while they are consolidating or forming a long base under the resistance.
Resistance is the area where sellers appear — represented by both short-sellers and profit-marking buyers. These possible scenarios may result in a price reversal. The more times resistance is tested the more stable it is. The closer the previous resistance hits are to the current price, the more relevant those values are. Resistance plays a very important role in the activity of trend traders because in their understanding it is that if the price breaks resistance it can make a breakout and start a new uptrend. The longer the share price has been in the area between support and resistance, the higher the chances of a breakout. After the breakout, the old resistance will become support.
Support is the area where buyers appear — represented by both buyers and short-sellers who cover their position. These possible scenarios may result in a price reversal. The more times the support is tested, the more stable it is. The closer the previous support touches are to the current price, the more relevant those values are.
Another form of support is the “pivot”. A pivot is a group of at least five candles that form a “V” shape pattern and contains: the lowest candle, two candlesticks on the left side that have two lower lows, and two candlesticks on the right side that have higher highs. Breaking support again attracts short-sellers who bet on an accelerated price decline.

The two notions do not necessarily refer to fixed values but a range or area where there is a major trading interest.
The importance of support or resistance is given by the number of tests it has taken part in. The more times the price tests support or resistance, the more that level becomes key in the subsequent price evolution.
Even if they are not support or resistance, the averages on the charts can act like these because they are considered important elements in the price evolution of a stock. The most used at the moment are the EMA10, EMA21, SMA50, and SMA200. There is no recipe for every trader, there is a wide range of variants and values, but the idea is to use the most popular ones to increase the chances of a pattern being seen by as many traders as possible at a time. The easier a pattern is to identify, the more visible and the cleaner it is, the more traders will buy it and the greater the chance of success. Again, averages are not support or resistance because they have no volume history on them. But if they coincide with a support or resistance zone, then the importance of that zone will increase.
What are the traders looking for when picking the perfect stocks?
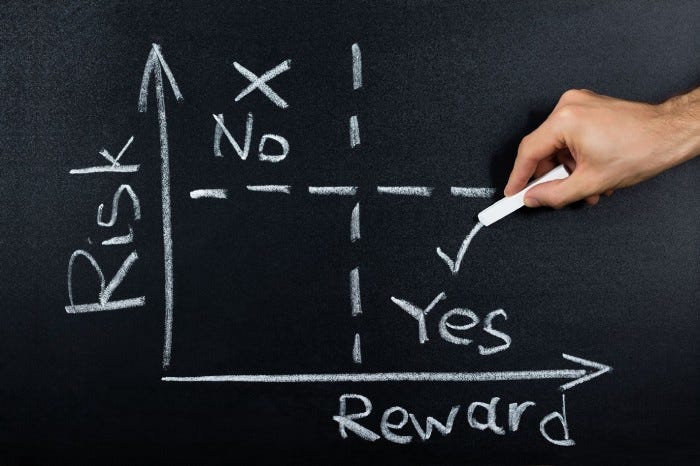
Before trading stocks, one must understand that this business is about probabilities. There are no 100% safe methods or ways to trade stocks. All the trades have a risk associated with them. As already mentioned, choosing the stock to trade is about identifying the ones that can move in the anticipated direction while taking the smallest possible risk. And let the trade develop if on profit and cut the loss immediately if the anticipated outcome didn't occur.
“Investing in stocks is an art, not a science, and people who’ve been trained to rigidly quantify everything have a big disadvantage.” Peter Lynch
This quote is very relevant for the next section of the article in two directions:
the following things a trader is looking for when choosing the stocks are not guaranteed. It is not an exact recipe. And they will never occur all at the same time or at the highest level. The experienced trader has the knowledge that makes him or her push the acceleration pedal or not.
the second point is about probabilities. Understanding the numbers game (including the full interiorization of this process) is paramount for success.
Experienced traders seem to be lucky. Yes, they can be lucky, but luck came only after many thousands of hours studying past moves. They do not trade all the stocks available on the market. They filtered them and check just the ones that “hit the screen”. Mostly all the following filters can be used on watchlists or programed on the chart software.
From now on, let’s assume the anticipated trend is up and the type of the desired trade is long. If selling short, the logic behind all these filters will be in reverse.
So, here are the filters:
1 - First of all, the company must be financially solid. Good earnings attract investors and traders want to see the volumes coming in. One of the best methods to be used here is CANSLIM by William O’Neil.

C - Current Quarterly Earnings
Current quarterly earnings per share (EPS) should increase by at least 25% when compared to the same quarter from the year before. Additionally, accelerating EPS growth in recent quarters is a strong positive sign.
A - Annual Earnings Growth
Annual earnings should be increasing over the last five years. Additionally, yearly EPS should be growing at least 25% or more over the past three years.
N - New Product, Service, or Management
There should be new things that are positively affecting the company’s future and driving the stock price — new products, services, or a newly-appointed strong management team.
S - Supply and Demand
The company should have a high trading volume during price increases and have a small float (fewer shares outstanding) relative to other companies.
L - Leader or Laggard
The company should have a relative price strength of 80 or higher. Relative price strength is a technical indicator and shows the performance of a stock relative to the market.
I - Institutional Sponsorship
The company should have an increasing number of institutional investors buying the stock. Examples of institutional investors include mutual funds, pension plans, banks, government bodies, and insurance companies.
M - Market Direction
Stock purchases should only be made when the market direction is upwards. O’Neil indicates that a stock may satisfy the first six factors of CAN SLIM and still sink if the market is on a decline.
Besides these, traders (as investors) check the growth companies and look for:
rapid revenue growth, more than 50% increase from Q to Q. The higher, the better.
recurring revenues and high gross margins. In SaaS businesses, margins are higher than in the other businesses and their evaluations are higher than averages.
dollar-based retention rate to be over 110%.
positive free cash flow (FCF).
no debt.
founder-led and insider ownership.
2 - The stock price must be on an uptrend. To assess the trend, we look at the most used averages EMA21, SMA50 and SMA200 and want to see them in this order: EMA21 above the SMA50 and above the SMA200.
Another method is Stage Analysis by Stan Weinstein which uses chart patterns to describe four distinct stages that a particular trade can be in. The stage, and transitions between stages, have specific guidelines for whether a trader should buy, sell, or hold the trade. This creates a simple strategy to follow when trading the market. Stage Analysis helps traders identify and stay invested in long-term trends in the market.
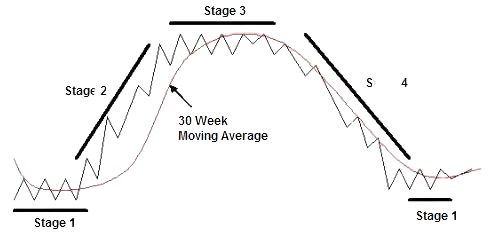
The main indicator is the SMA30 on weekly charts and the key stage is Stage 2 as this is the only stage when stocks must be bought. The ideal buy point is in fact the breakout from Stage 1 to Stage 2.
3 - Stock doubled or tripled in the last year or less. This signals a great interest and mostly it is about Institutional accumulation. If a stock did such a move, there are chances to do it again.
4 - Stock are to be in the all-time high (ATH) area. A strong stock is always preferred to a weak one. Buy high and sell higher than buy low hoping for a reversal.
5 - When in a consolidation, the stock that corrects in time than in price is stronger. After a big move, a lateral consolidation is bullish.
6 - If the correction is made in price, it needs to be max. 30-35% of the price at ATH. If the price decrease more, the chances are to not see it back to ATB back soon. The damage takes time to be repaired.
7 - When the pattern is buyable on a daily graph, there are bigger chances of success if the same pattern looks buyable on multiple frames as well. In this case of the daily graph, it is better the pattern looks good on the weekly and monthly graphs as well.
8 - The overall price action must be clean and clear. A stock that respects the averages, the supports, or the resistances is preferred to the one that has gaps, big spikes, or any other strange movements.
9 - The stock needs to be in a good sector and industry. If the leader, the better.
10 - The price is better when it is close to the main averages (EMA21, SMA50 or SMA200). These are good entry points for Institutions so take this train whenever it is possible.
11 - Trade can be initiated with low risk. Strong support must be very close in order to be able to minimize the risk.
12 - Stock price must be in a pattern. A very well-known pattern is preferable, the idea is to be easily identified by many other traders. Examples of patterns: cup with or without handle, flat base, wedge formations, channels, flags, pennants, head and shoulder, parabolic curve, ascending triangle, etc. If the price shows a volatility contraction pattern (VCP), the better. No pattern, no trade.
13 - Volumes need to be low or on a decreasing trend before an anticipated breakout. It is better to have weekly skyscrapers (long bars) during previous advances and very low volumes when in correction/consolidation.
14 - Same for ATR (average true range), we like to see it decreasing in order to be able to use a strong Stop Loss. Volatility must be low.
15 - Another indicator I look at is Dollar Volume. I would like to see good numbers, the higher the batter. It means there is interest in trading and there is no risk for getting rid of shares when one needs to.
16 - Market is unpredictable and the stocks act accordingly but look for rapid comebacks (like tennis balls) and disregard the eggs (stocks that go down and remain there). Check stocks that show relative strength (RS).
17 - Average daily range is a technical indicator used to measure the volatility of an asset. Its value has to be chosen based on the trader's preference.
18 - Generally, traders prefer some stocks at certain levels. The most common price level is between $100 and $200.
You may consider these as a guideline, do not try to find exact levels and remain trapped in. Every trader has his or her own set conditions, they may use them or not. They may use them as a sine-qua-non condition or as a nice-to-have condition. One might be important and the other maybe not. Decide for yourself what is good and what values are important.
Great post!
Great article! Could you please find me someone who is using these principles to follow.