


🧠 The Holy Grail of Trading Isn’t a Signal — It’s Your Journal
The unsexy habit that separates blown accounts from billion-dollar traders

Imagine if every mistake you made in trading came with an instant replay. A voiceover, slow-motion, and freeze-frame that lets you zoom in on the precise moment your conviction turned into confusion. Most traders don’t want to relive that agony — but elite traders insist on it.
Welcome to the world of the trading journal — the most powerful, most overlooked, and most emotionally uncomfortable tool in a trader’s arsenal. As Jesse Livermore warned:
“The examination of a losing trade is torturous but necessary to ensure that it will not happen again.”
And that, friends, is why this seemingly simple spreadsheet is the holy grail of consistent profits.
🎯 Why a Trading Journal Beats Any Trading Tool
Indicators? Helpful. Scanners? Useful. But when it comes to behavioral edge, the journal reigns supreme.
Here’s why:
Self-awareness kills bias: Most traders think they follow their rules — until the journal exposes otherwise.
Pattern recognition: You start seeing your own behavioral setups (like FOMO Fridays or Overtrading Mondays).
Continuous improvement: The best traders don’t trade better setups — they trade themselves better.
As Brett Steenbarger puts it:
“A journal keeps you constructive, keeps you learning, and keeps you working on the things that are most important.”
Still think this is soft stuff? Just ask a few billion-dollar hedge fund managers how many of them journal. You’ll find it’s almost all of them.
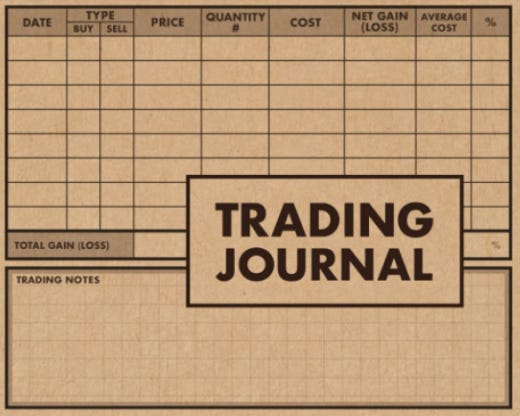
📒 Anatomy of a Great Trading Journal (a.k.a. Your Performance X-Ray)
Let’s break it down like a performance pit stop in Formula 1. You don’t just want notes — you want data, behavior, reflection, and action.
🧩 1. The Basics (Every Trade Starts Here)
Date & Time: Patterns emerge — like a trader who loses money every Monday before 10:30 AM.
Ticker & Exchange: Useful for filtering asset class performance.
Idea Source: “Reddit YOLO” or “Own Analysis”? Be honest. Track what sources work.
Earnings Proximity: Caution zone. Avoid being steamrolled by a surprise EPS.
Pattern: No pattern? No trade. This one field will cut half your bad ideas.
🗺️ 2. The Plan (Pre-Market Clarity)
This is the “If-Then” logic before emotions kick in.
Entry: Use a Buy Stop Limit to avoid premature entries.
Stop Loss: Defined risk = longer career. Period.
Target / Potential: Must be at least 2x your risk. Preferably 3x. If not? Pass.
Risk/Reward (RR): Automatically calculated. Think in R multiples, not dollar signs.
Max Shares: Calculated by risk unit, not excitement.
“Love your stops, not your stocks.” – Dan Zanger
📉 3. The Execution (Reality vs. Plan)
This is where your discipline gets exposed.
Realized Entry: Slippage? Hesitation? Fat-fingered?
Actual Shares: Did you size down at the last minute? Why?
Current Price & PnL %: Pulled automatically — no excuses.
Trailing Stop or Adjusted SL: A key sign of dynamic risk management.
Heat: Measures your exposure in R-units. It’s your stress barometer.
Live R: How many risk units are you up or down right now?
Example:
You bought 10 shares at $80, stop is $75, target $95. That’s a $5 risk.
Now it’s trading at $100? You're at +4R. Smile — but don’t get cocky.
🏁 4. The Exit(s) (Where Real Edge Hides)
Don’t just track when you sold — track how.
First partial exit? Second? Third?
Why did you sell there?
Were you reacting to price or sticking to the plan?
The best traders don’t just exit — they scale out with intention.
🔍 5. The Review (aka The Pain & Growth Zone)
Status: Open or Closed.
Total R: This is your scoreboard.
Feedback: What happened? Emotional? Late entry? News surprise?
Kill the Demon: Your behavior hack. What will you do next time?
“The human mind is a pattern-making machine — which is great for survival, but terrible for trading.”
You can’t out-discipline your psychology — but you can out-data it.
📊 The Trader’s Dashboard: Monthly Stats That Matter
Here’s where your inner portfolio manager comes alive:
🧮 Total Trades
✅ Winning % (Batting Average)
💰 Average Win in R
🔻 Average Loss in R
🔁 Risk:Reward Ratio
🧠 Expectancy = (Avg Win × Win%) – (Avg Loss × Loss%)
📉 Heat Exposure
📈 Adjusted R (after fees/slippage)
📐 Gaussian Distribution Curve of Rs
If your expectancy is negative? Stop trading and journal harder. Your future P&L is written in these patterns.
“If you can’t measure it, you probably can’t manage it.” — Ed Seykota
🧠 Final Thoughts: The Spreadsheet That Changed My Life
I discovered my worst habits — early entries, stubborn holds, overtrading after losses — only after logging every trade for months.
That sheet? It told me who I was really trading. Not the market — myself.
So build your own. Use Excel, Notion, Airtable, a napkin — I don’t care. Just make it yours. Too many metrics? It becomes a burden. Too few? You miss the patterns. Start with what matters most to you, and expand only if it serves clarity, not clutter.
✅ Key Takeaways
Your trading journal is your real-time mirror — and your long-term mentor.
Plan before the trade. Reflect after it. Evolve through both.
Focus on Rs, not dollars — play the game, not the outcome.
Use data to see your psychological traps.
Build the journal for you — not to impress anyone else.
🎤 Closing Line
In the markets, the crowd looks for the next secret indicator, insider tip, or guru subscription. But the real secret? It’s sitting in your post-trade notes.
So the next time someone asks you for the holy grail of trading, smile, open your spreadsheet, and say:
“I built it myself.”
GreaT STUFF MAN!