

Trading Plan: 27 March 2023

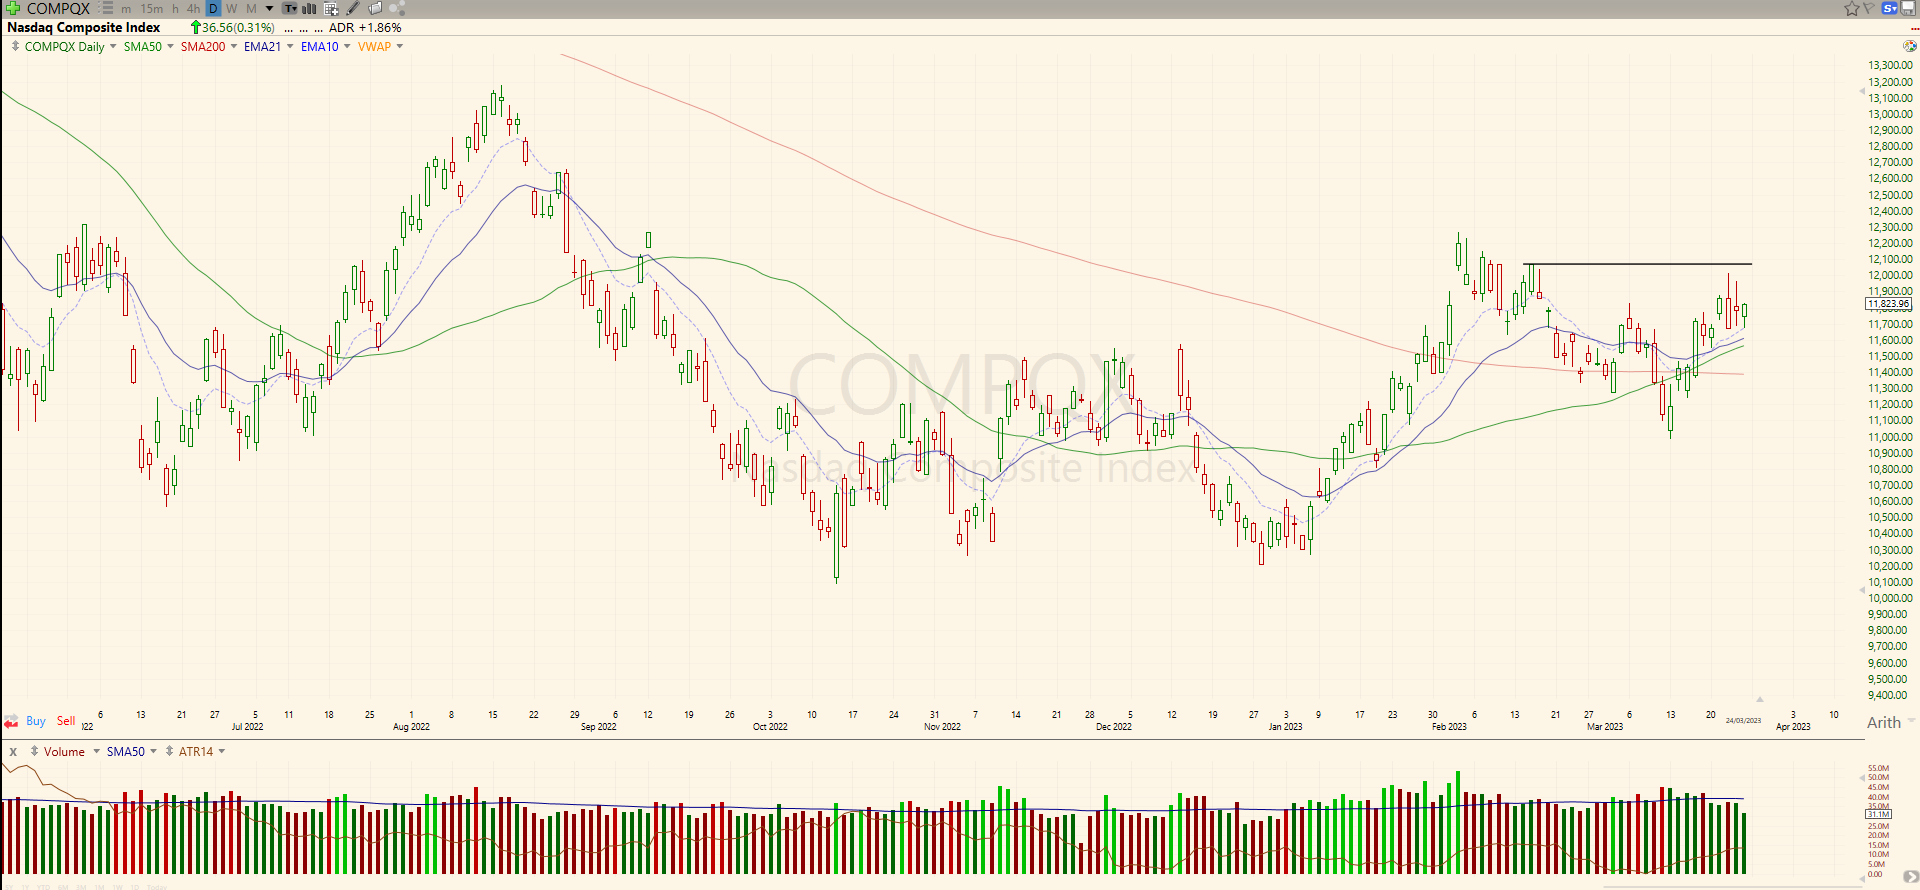
Nasdaq (+0.31%) had an inside day with low volumes. It seems the traders are still waiting for a direction. The overall reaction to the FED news is not bad, but watching and waiting for a direction is paramount now. The price is above all the key averages and might test the recent highs or even the next resistance at 12,100 - 12,270. As always, be prepared for the red scenario by watching the averages and last week low at 10,985.
SP-500 (+0.56%) also had a pause day, consolidation between the key averages. The average volumes confirm that traders are not betting yet on a specific direction. A price above the downtrend line with volumes might be constructive while a close below the SMA200 or even below the recent low at 3810 could signal lower prices for the index.

In the news
First Citizens FCNCA 0.00%↑ to buy a large chunk of failed Silicon Valley Bank SIVB 0.00%↑.
Amazon AMZN 0.00%↑ and other retailers revamp 'free' shipping as costs soar.
Elon Musk puts $20 billion value on Twitter, The Information reports.
Apple AAPL 0.00%↑ CEO praises China's innovation, long history of cooperation on Beijing visit.
Databricks pushes open-source chatbot as cheaper ChatGPT alternative.
Sectors
Best yesterday sector: Utilities, then Real Estate. Worst sector: Consumer Cyclical.
Best weekly sector: Communication Services, then Technology. Worst sector: Real Estate.
Best monthly sector: Communication Services, then Technology. Worst sector: Financial.
Sentiment
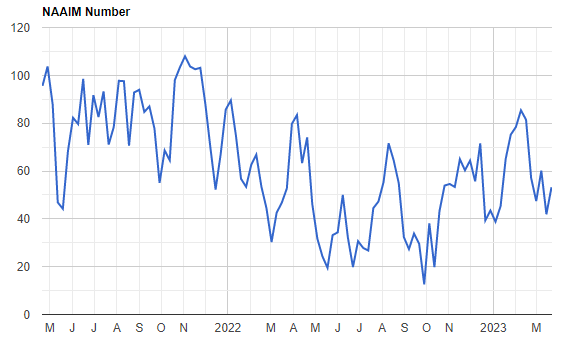
NAAIM (weekly, neutral between 70 and 90): 41.92. A small increase from last week, but the number is still low.

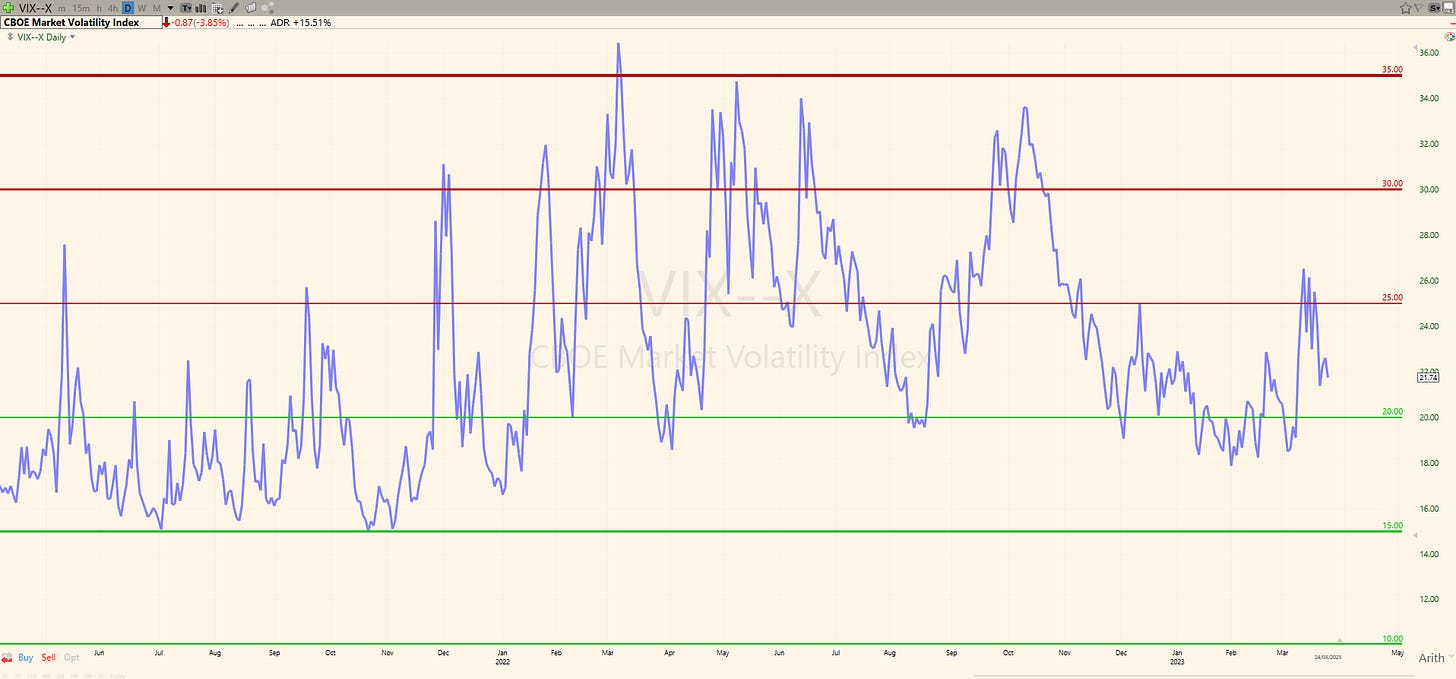
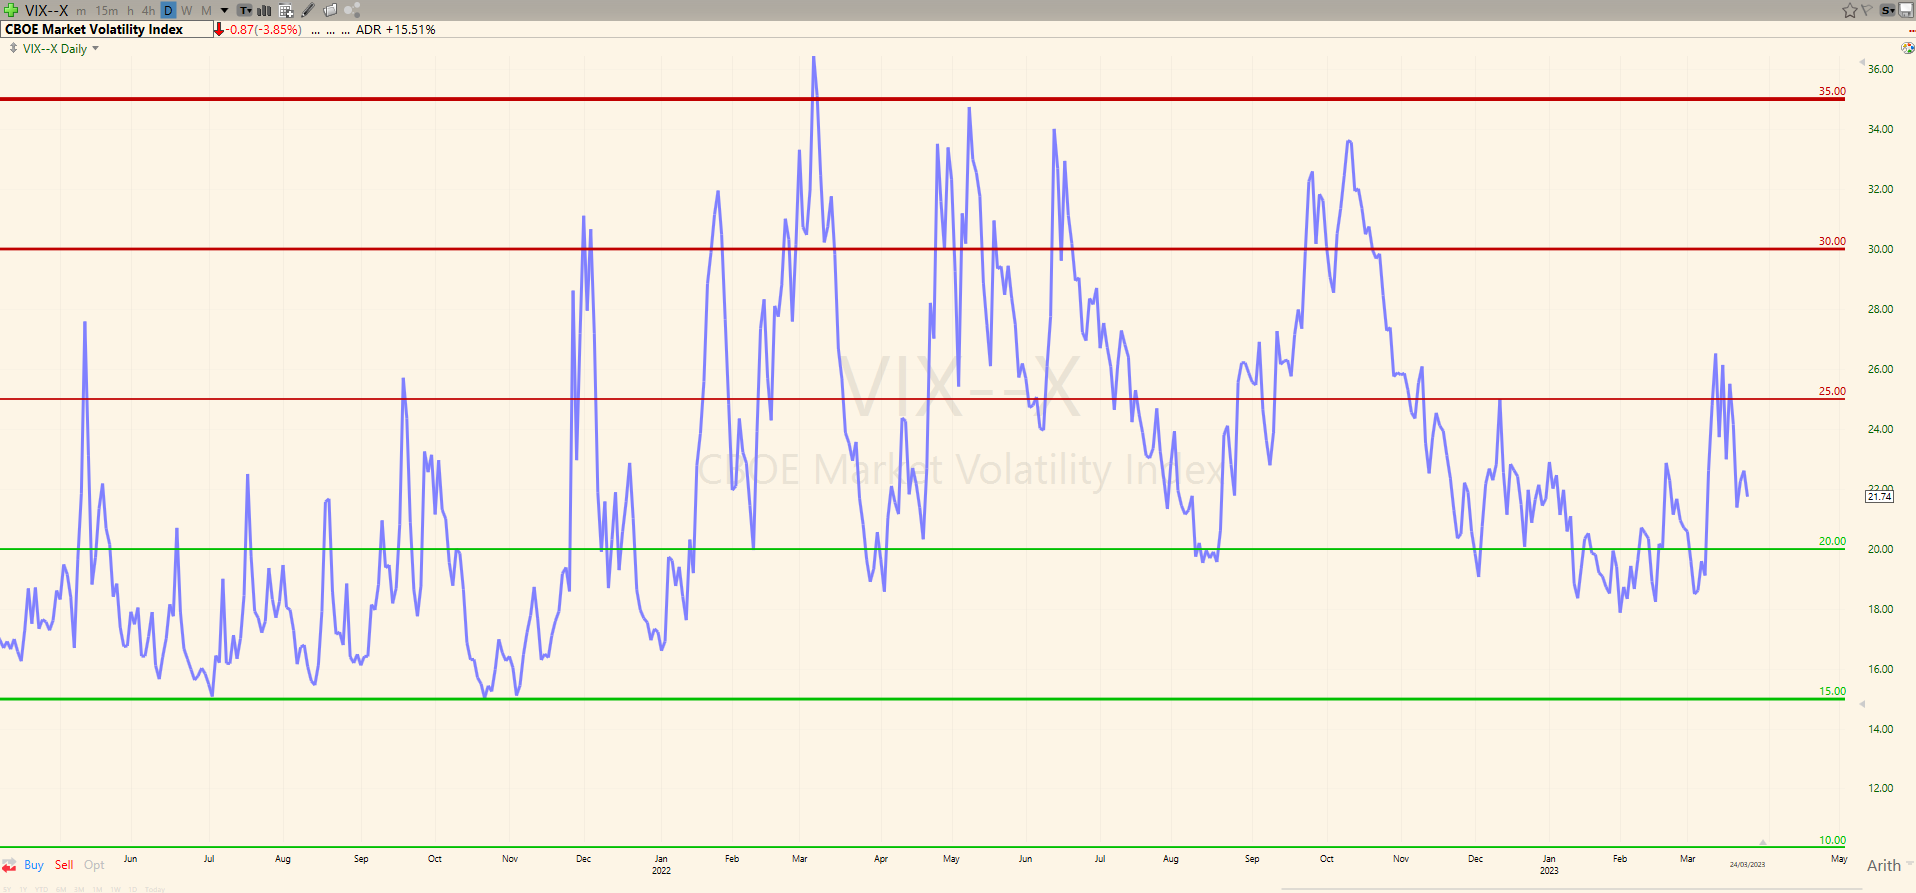
VIX (neutral under 20): 21.74 (decreasing - it will be good to see it below 20)
Put / Call Ratio (neutral between 0.7 and 1): 1.10. Since this is a contrarian indicator, we might expect a reversal in the market. This rule is on when the market is bullish or neutral. Now, in a bearish market, something pessimistic can become more pessimistic.
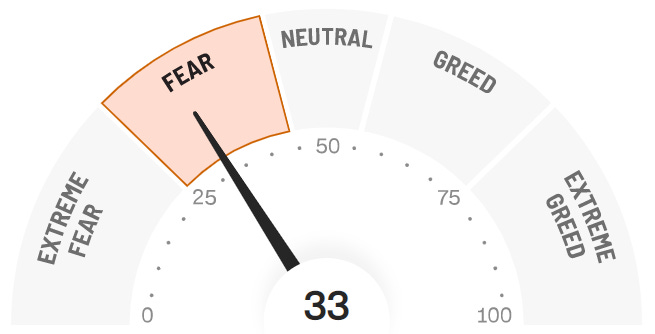
CNN Fear & Greed: 33 (Extreme Fear). Still in the Fear zone, so caution is required.

Breadth
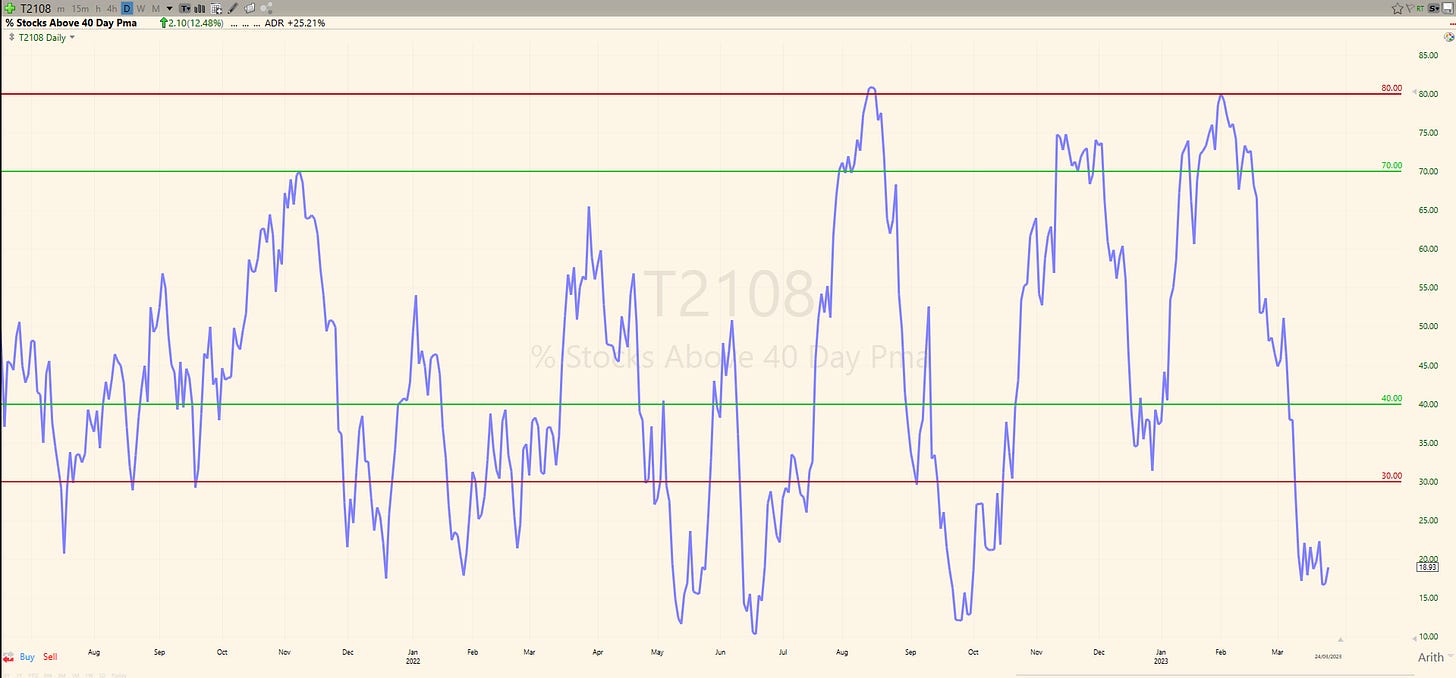
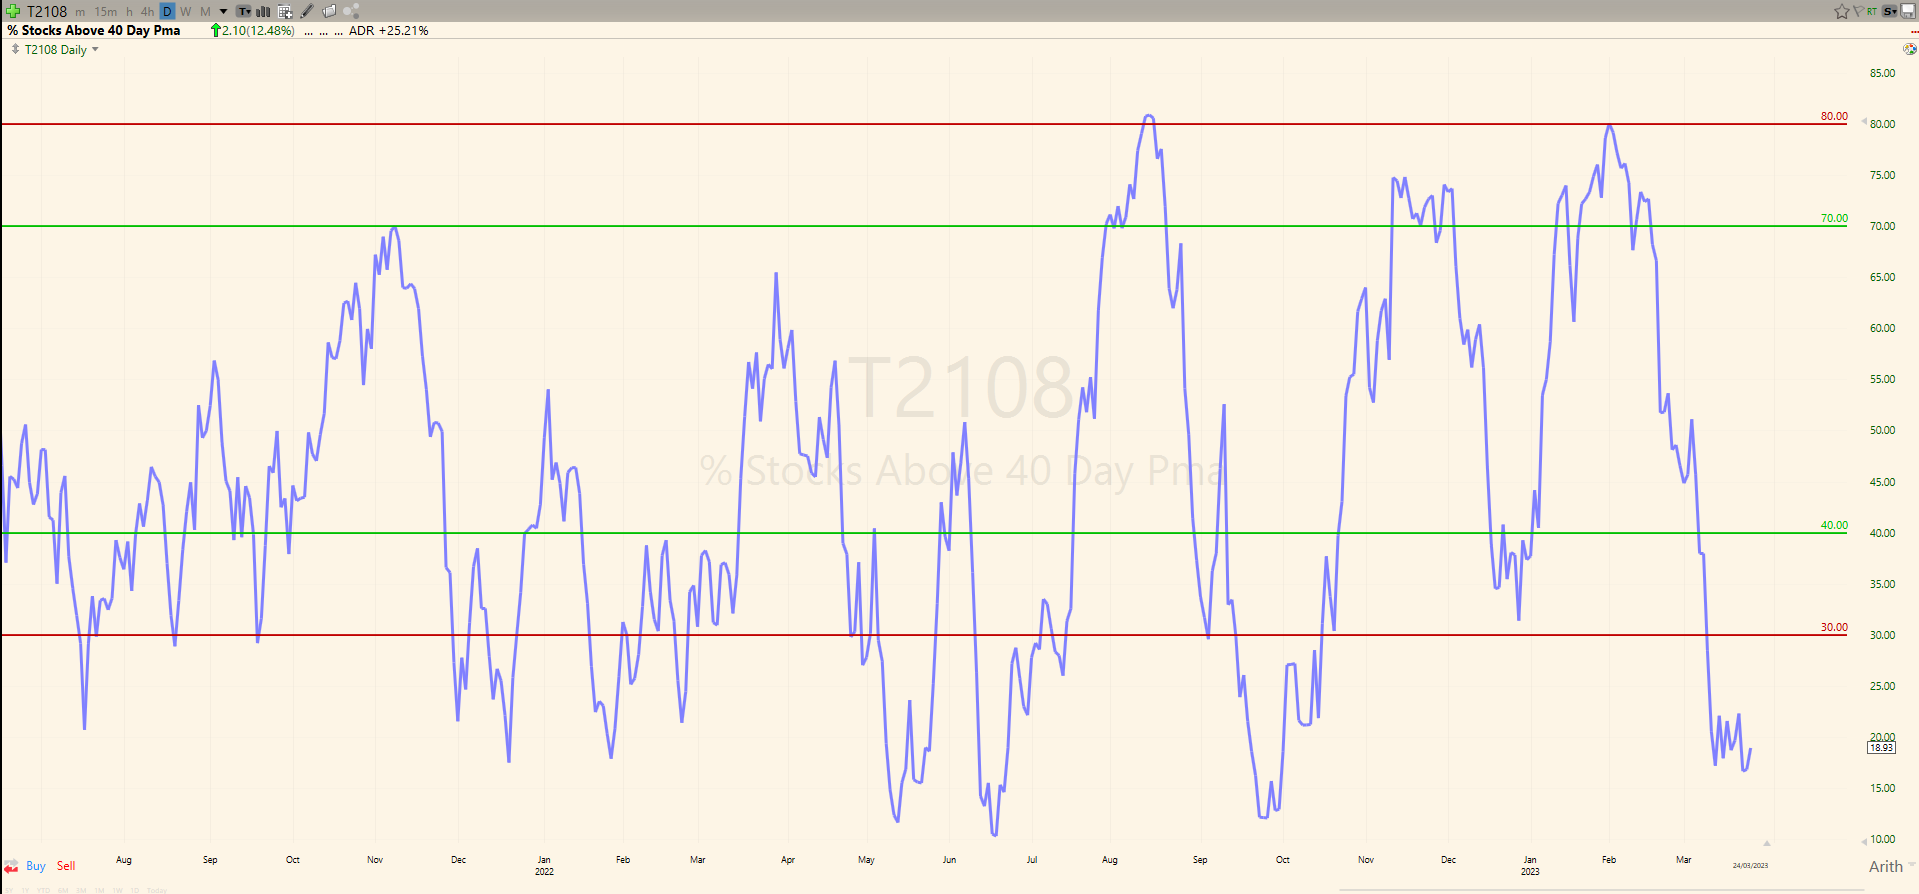
Stocks above SMA40 (neutral between 30 and 80): 18.93%. Not a good place to see the indicator, watching to see the direction after this consolidation. Take into consideration that a level below 30 is not a healthy sign.
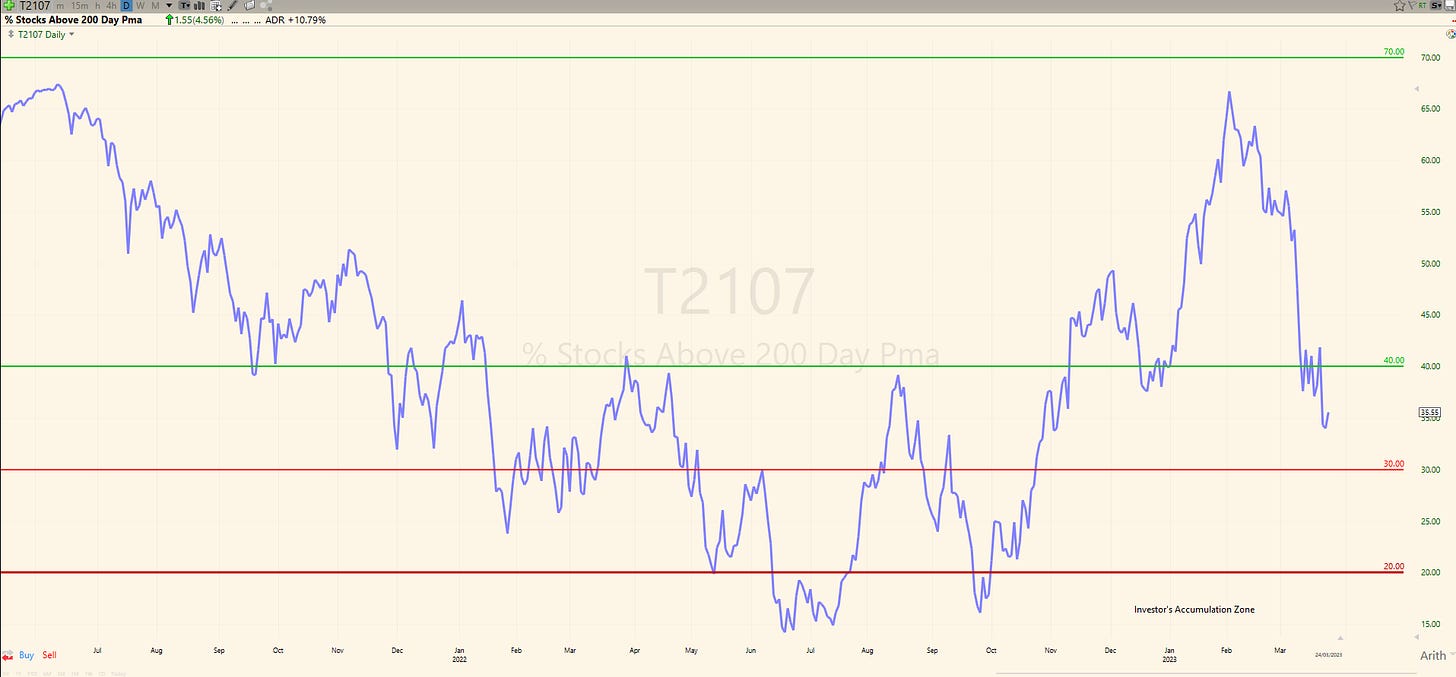
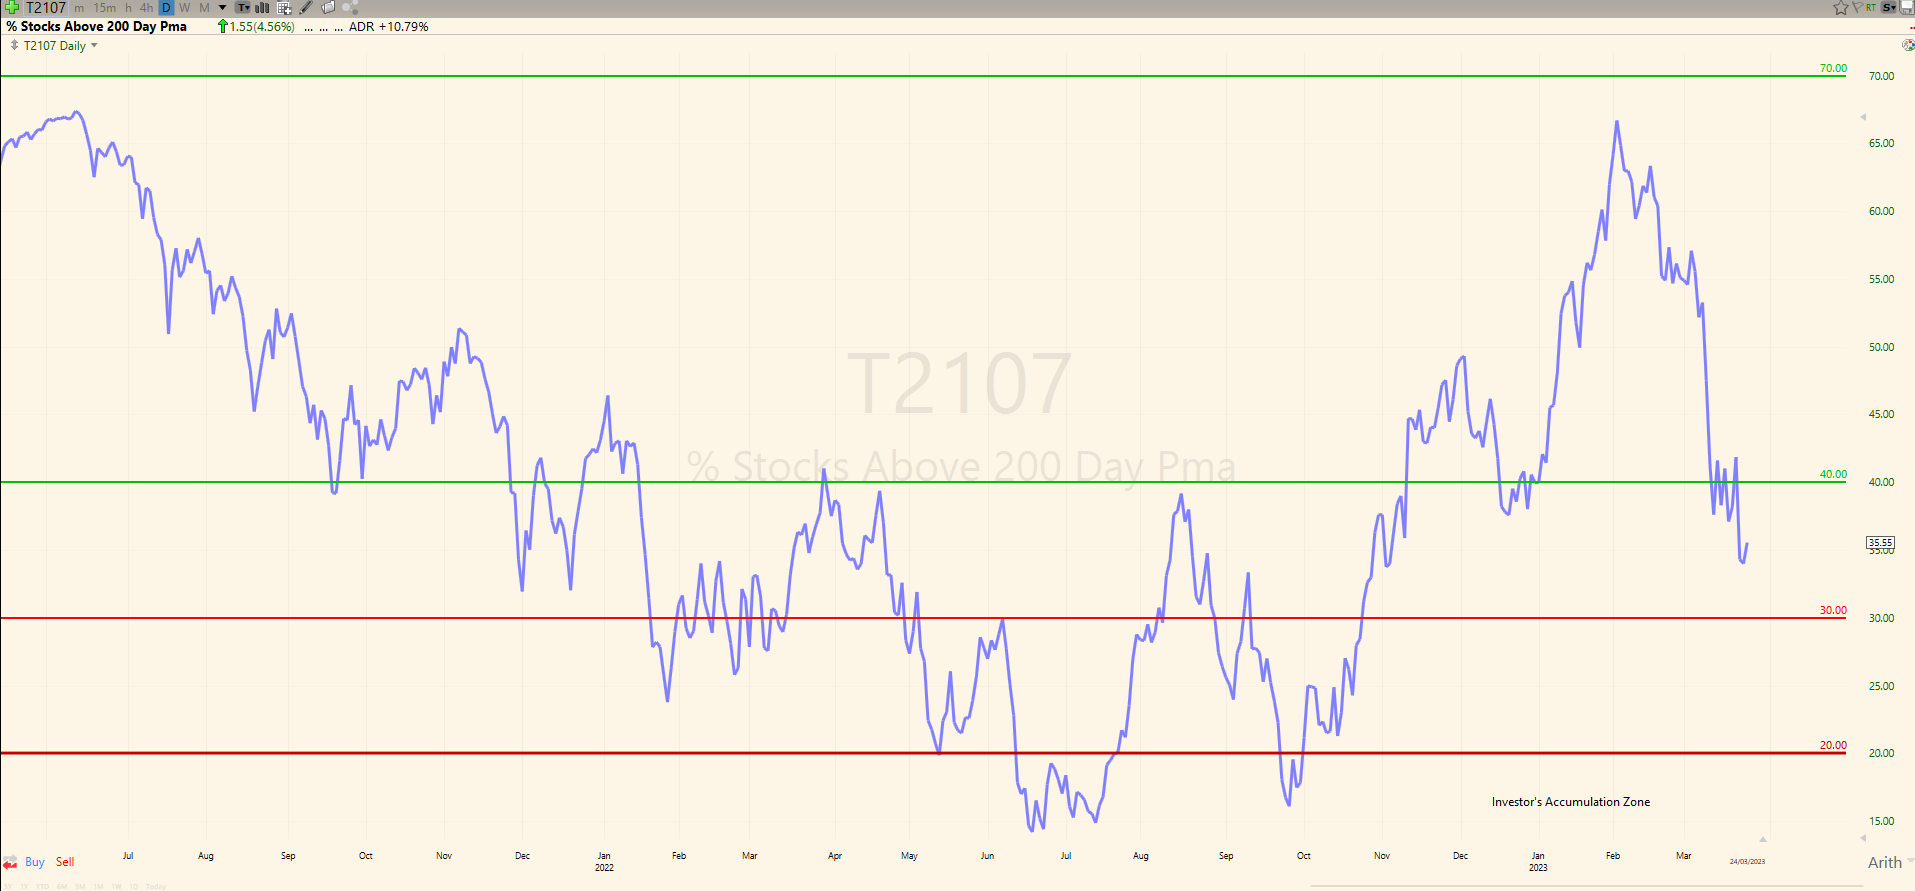
Stocks above SMA200 (neutral above 30): 35.55%. The same idea, it is better to see more and more stocks advancing, not lagging at the lows.
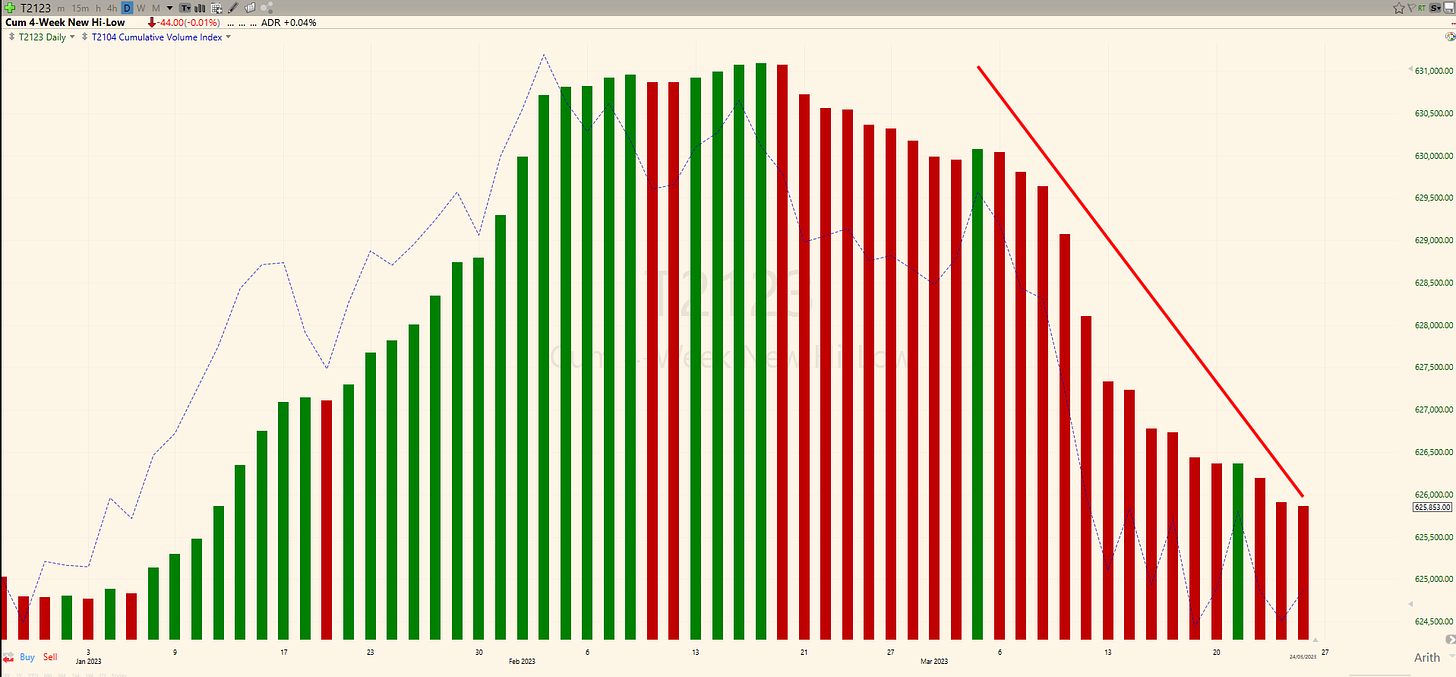
Cumulative 4-Week Hi-Low & Volume Index continued the downtrend. We want to see new highs and new volumes entering the market, not money going out of the market.

Nasdaq Advance / Decline Line lost its recent lows level & then reclaimed it. Watching for the direction.


Number of stocks that increased yesterday by more than 4%: 204
Number of stocks that decreased yesterday by more than 4%: 120
McClellan Oscillator (neutral between -100 and 100): -39.16. The indicator is neutral right now.


Earnings Reports
Noteworthy earnings reports for today

These are the stocks to watch for a possible earnings gap.
The most anticipated earnings releases for this week:

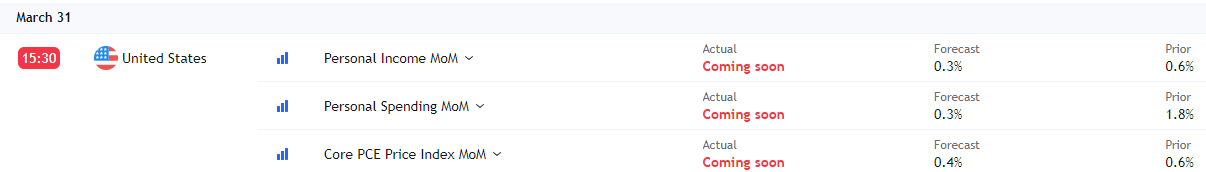
Economic Calendar
What to trade today
A choppy market is very dangerous and while Utilities were the top sector, Friday was a refugee day for the traders and investors. But, I like the patterns in AAPL 0.00%↑, MSFT 0.00%↑ , and the nice recent uptrend in $META. These might help the SP-500 index.
As stated above, the environment is not at its best. Even if there are some good setups, waiting for better times seems more logical to me. If you still want to trade, you might consider using tighter stops and taking profits sooner (if / when available).
This week I will watch the following industries: Communication, Software, Solar, Cooper, Gold, Cyber Security, and Internet.
Regarding the low-risk patterns, here are some potential breakouts:
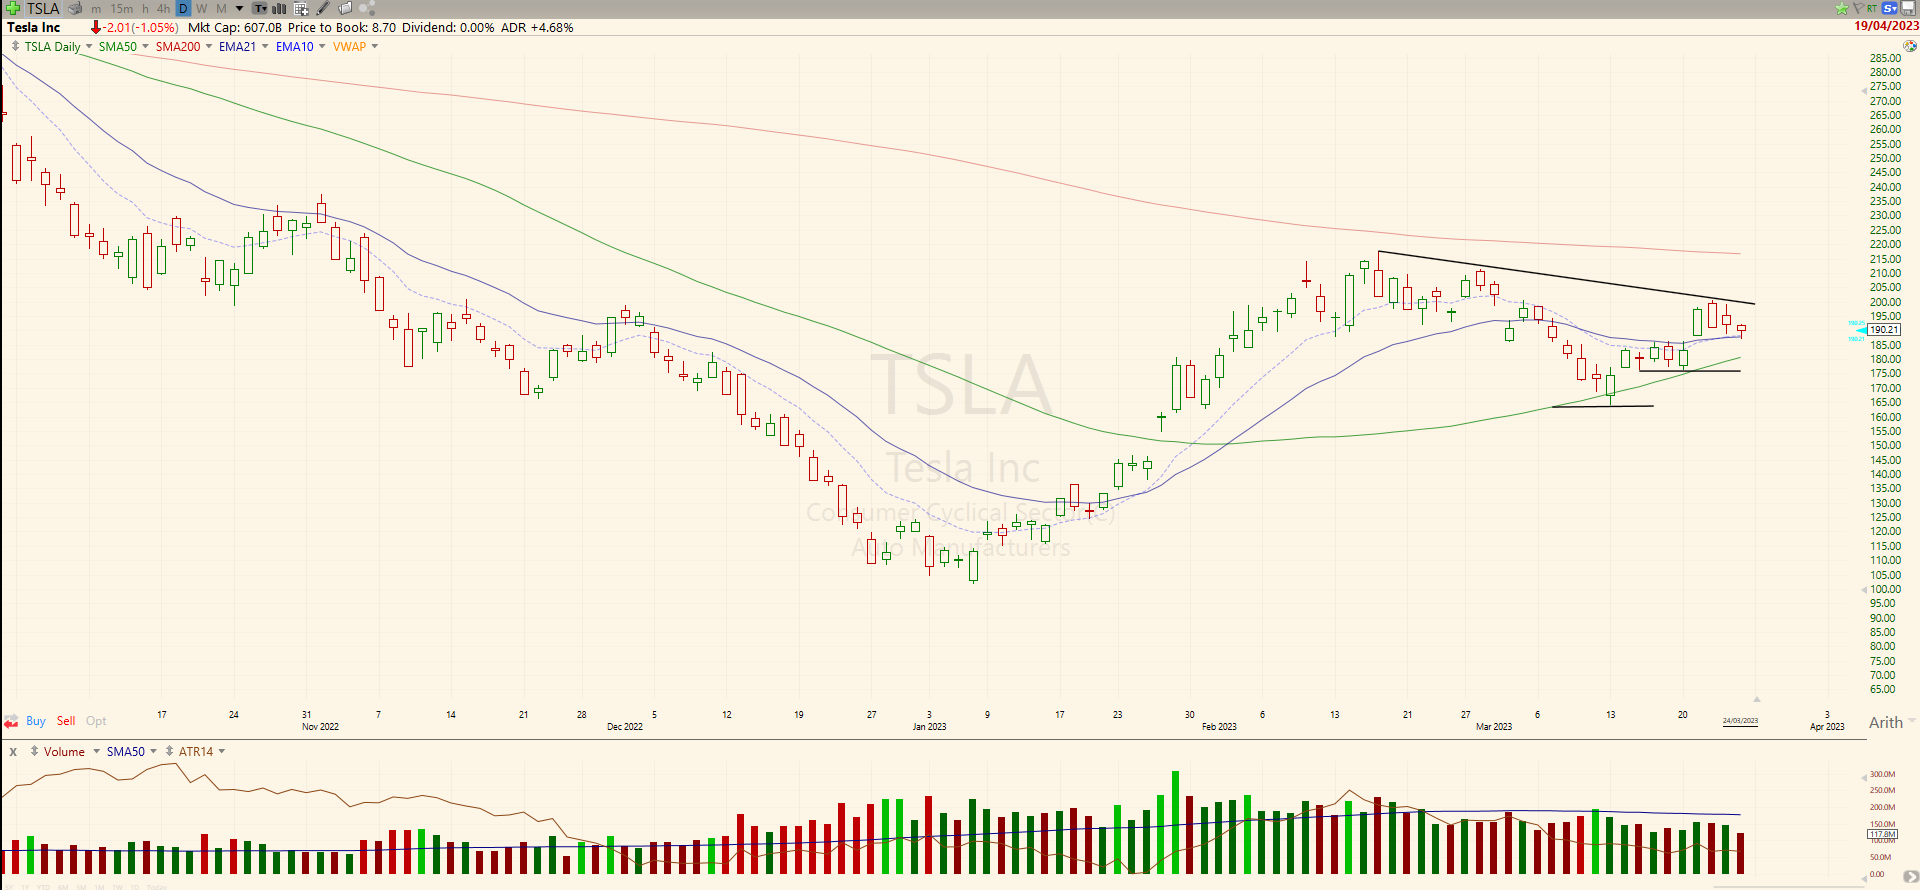
Tesla TSLA 0.00%↑ has a tightened pattern with higher lows around its EMA21 and SMA50, declining ATR, and below-average volumes. If the price tightens more, a breakout above the downtrend line might work. Stop loss in the EME21 / SMA50 area.
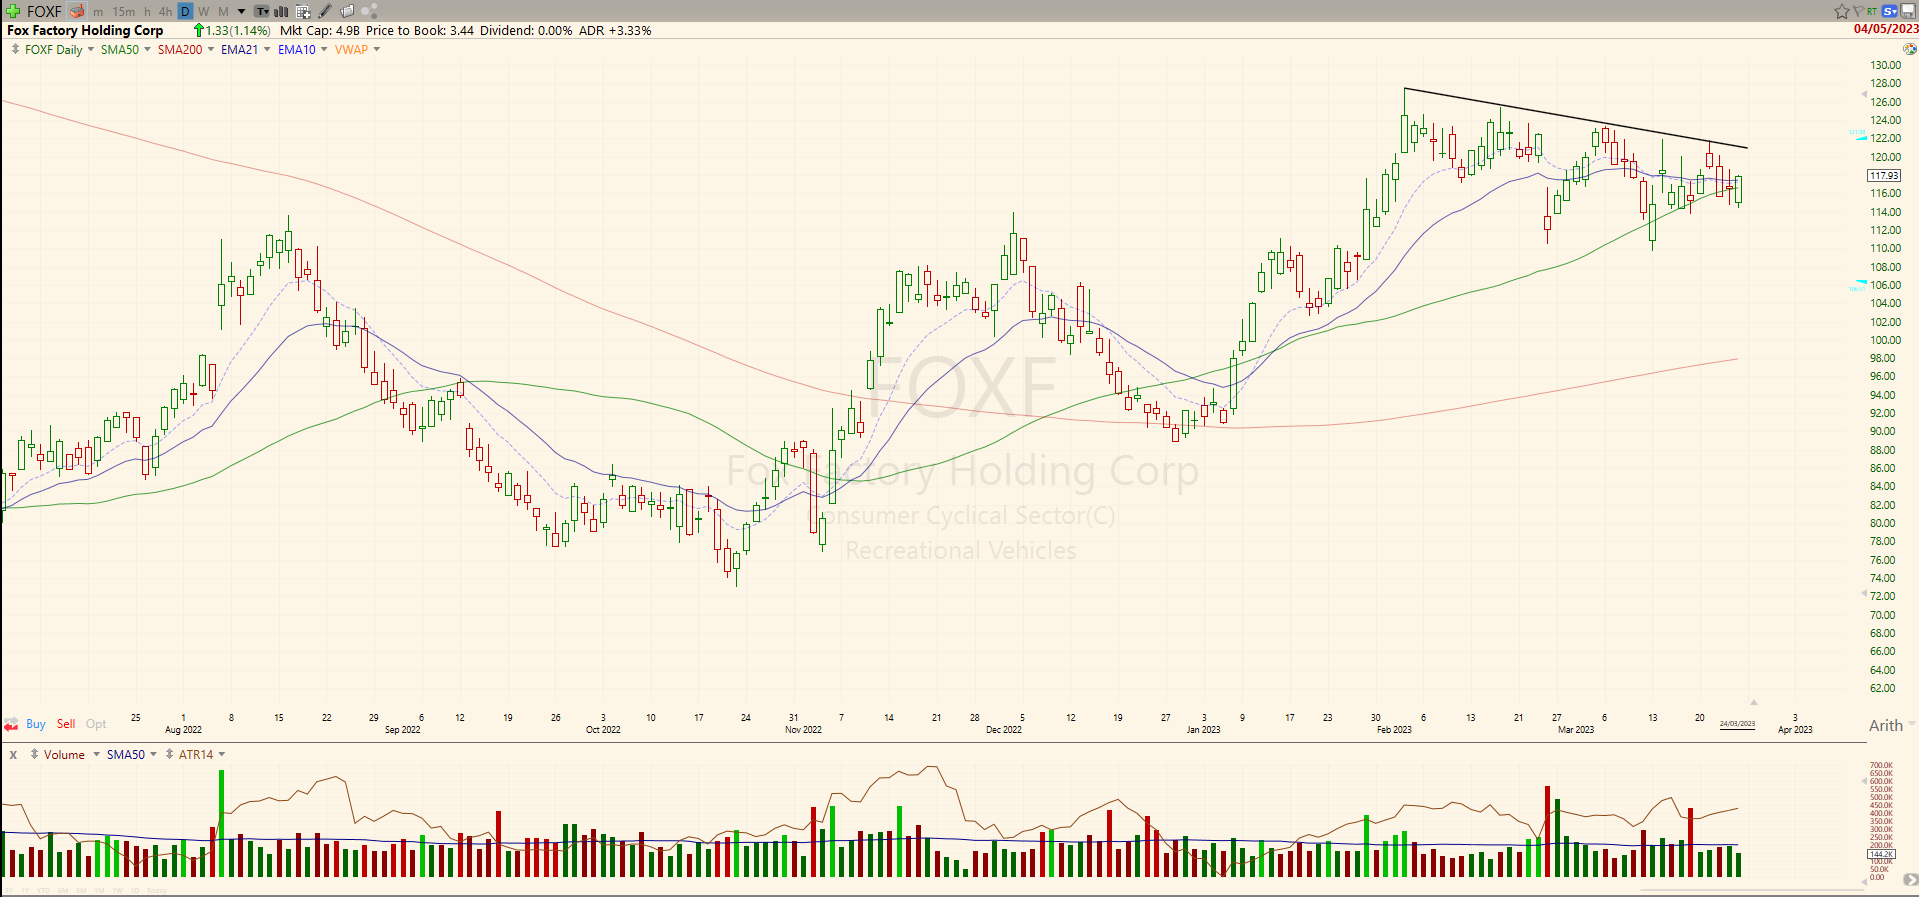
Fox Factory FOXF 0.00%↑ stays constructively at EMA21 / SMA50. If the price passes the downtrend line, the trade might work. Stop Loss at EMA 21/ SMA50.
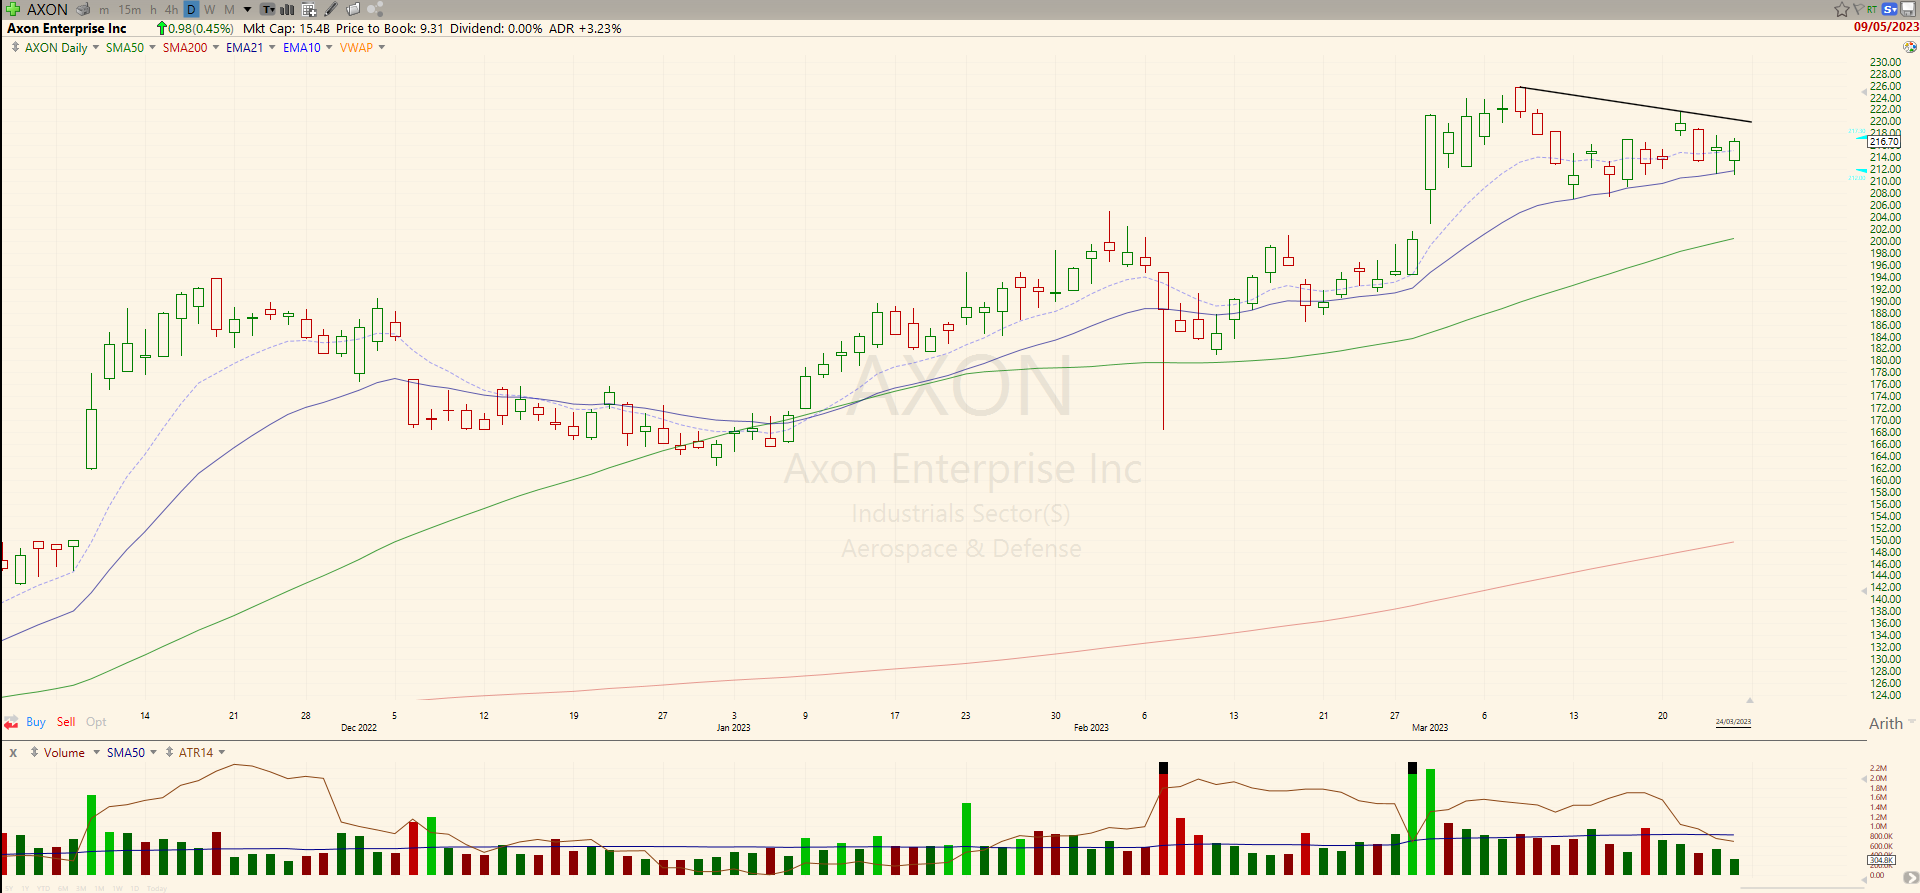
Axon AXON 0.00%↑ stays above all the key averages and id tightening more and more. A price above the marked line might work. Stop Loss at EMA21.
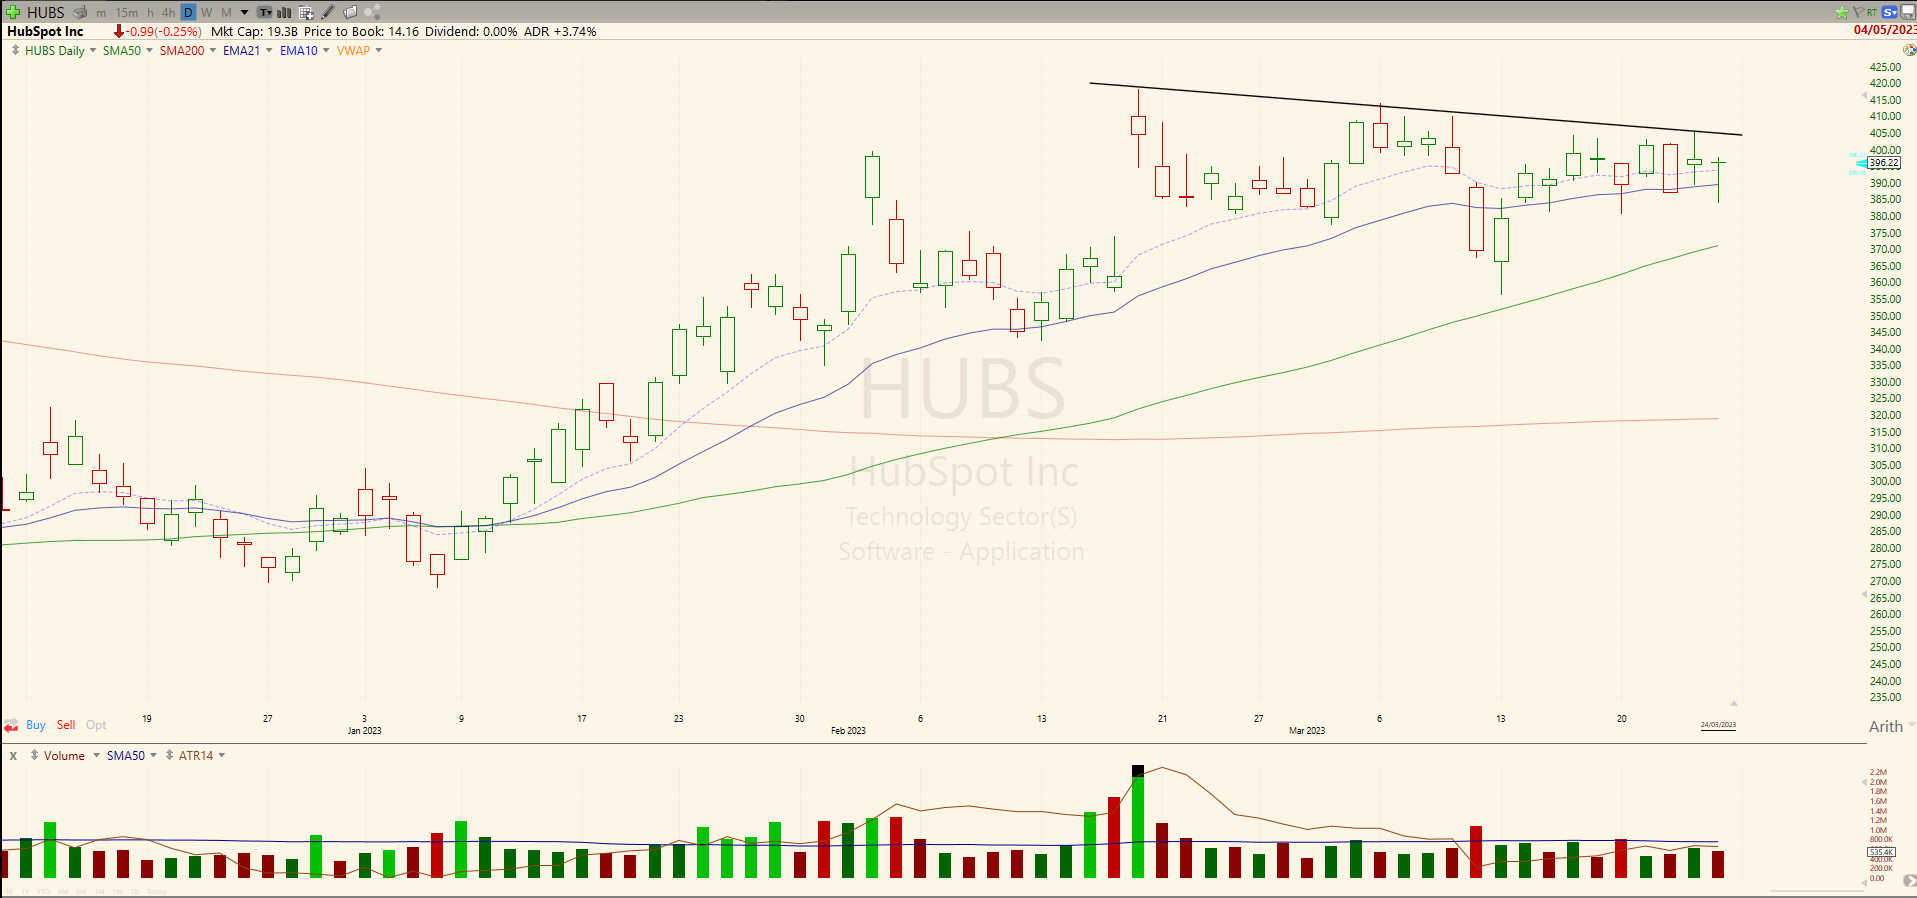
HubSpot HUBS 0.00%↑ is in an uptrend, lateral consolidation. It he has a declining ATR and low volumes. A price above the round number of $400 and big volumes coming in might signal a desire for higher skies.
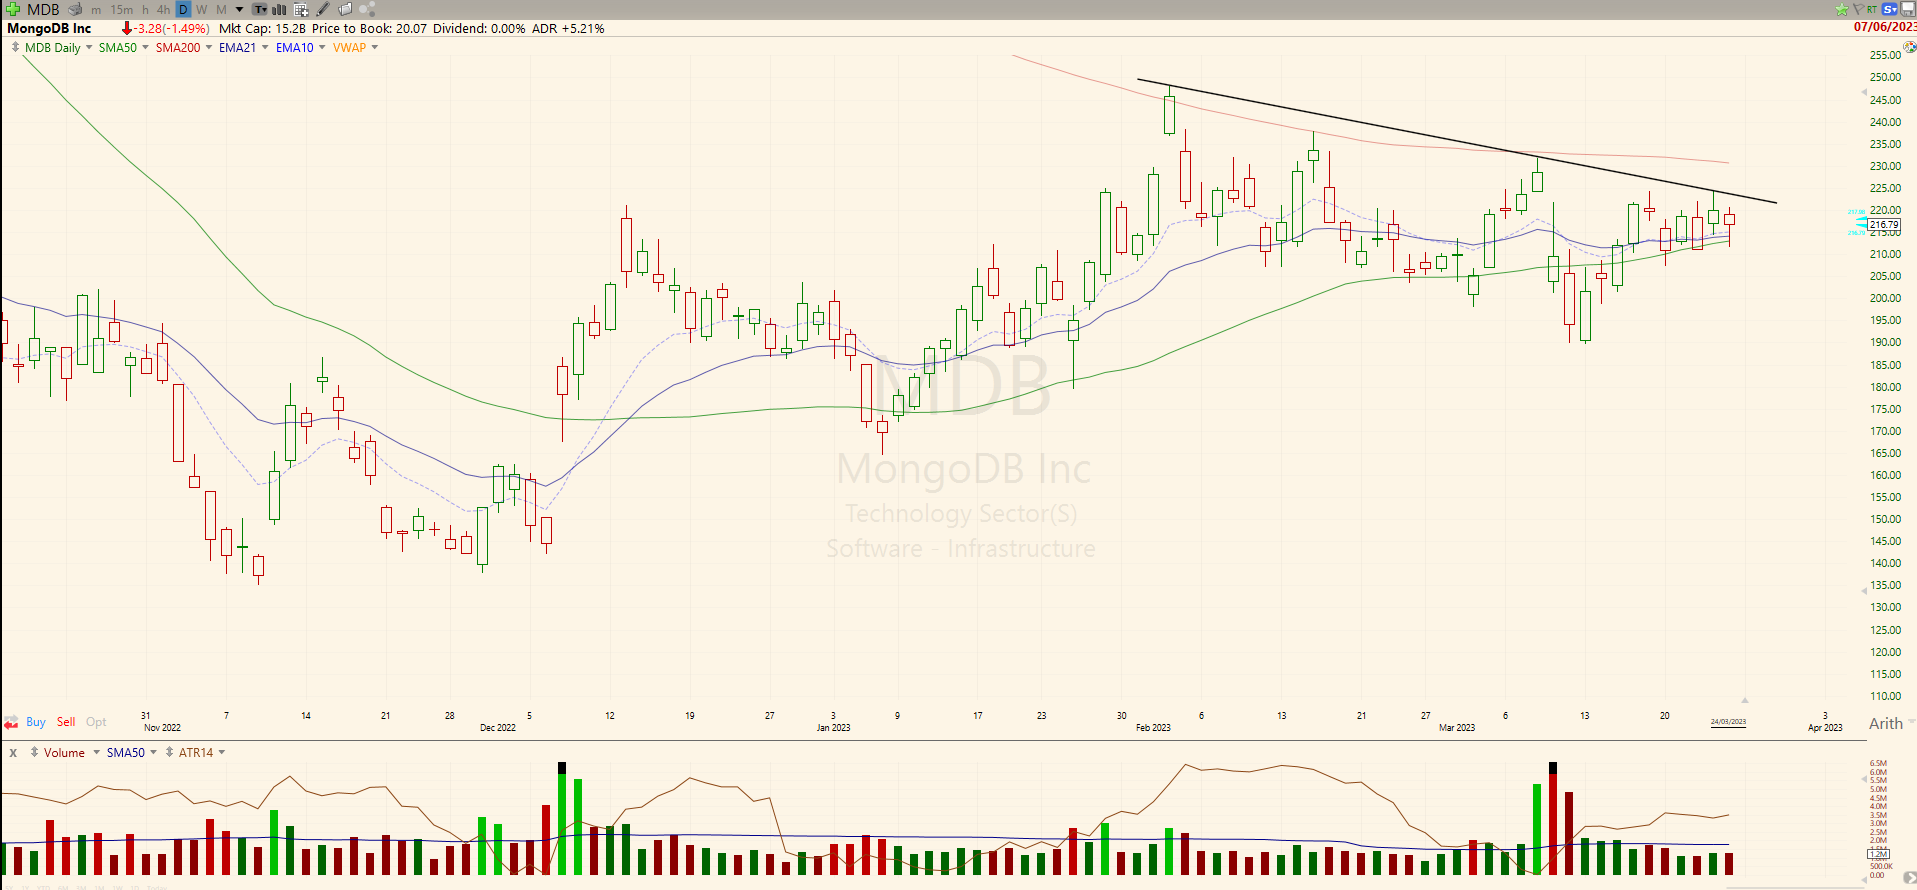
MongoDB MDB 0.00%↑ is consolidating above the EMA21 and SMA50 and it seems the price might pass the downtrend line. Stop Loss: EMA21/SMA50.
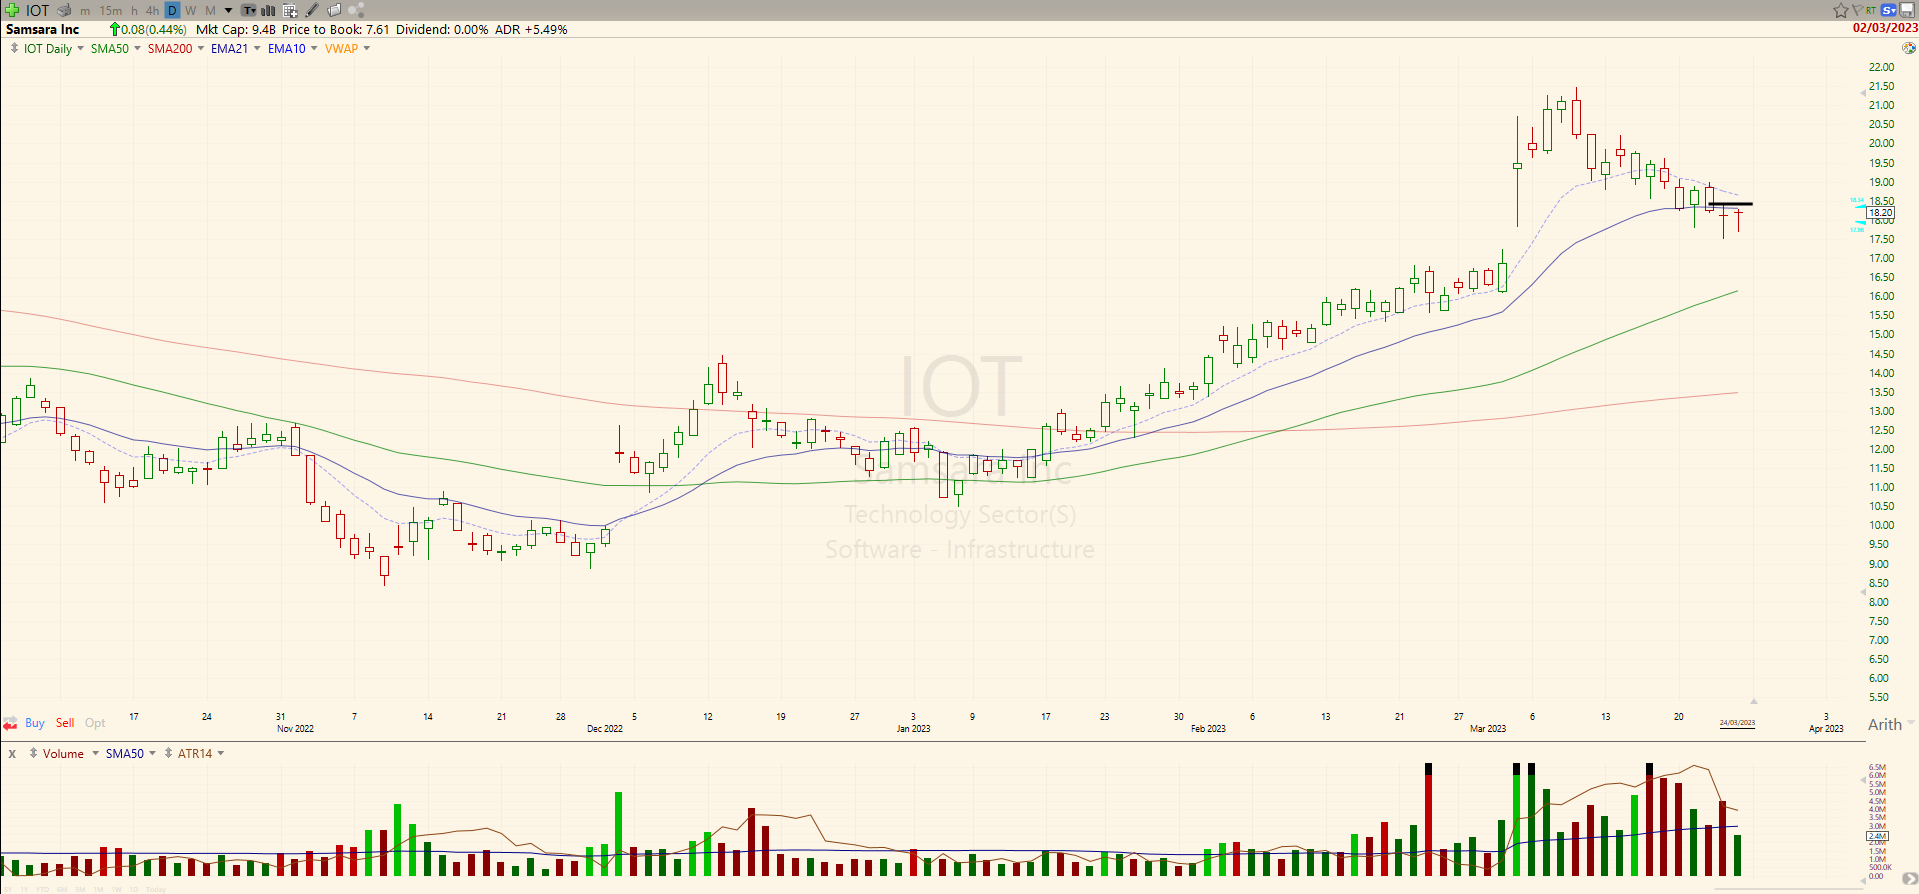
Samsara IOT 0.00%↑ made a retraceent to its EMA21. This pullback looks buyable and a price above the last two days' high might work. Stop Loss: $17.5.
Do your due diligence if or when placing a trade. All ideas stated here are my own and do not represent trading or investment advice.
In order to learn more about trading, you may want to read the following: